Experiments
The F_UNCLE project currently does not use any true experimental data
Gun
-
class
F_UNCLE.Experiments.GunModel.Gun(name=u'Gun Toy Computational Experiment', *args, **kwargs)¶ A toy physics model representing a gun type experiment
The problem integrates the differential equation for a mass being accelerated down the barrel of a gun by an the expanding products- of-detonation of a high explosive. The gun has finite dimensions and the integration lasts beyond when the projectile exits the gun.
Units
This model is based on the CGS units system
Diagram

variables defining the gun experiment
Options
Name Type Def Min Max Units Description X_i (float) 0.4 0.0 None cm Initial position of projectile x_f (float) 3.0 0.0 None cm Final/muzzle position of projectile m (float) 500.0 0.0 None g Mass of projectile mass_he (float) 4 0.0 None g The initial mass of high explosives used to drive the projectile area (float) 1.0 0.0 None cm**2 Projectile cross section sigma (float) 1.0e0 0.0 None ?? Variance attributed to v measurements t_min (float) 1.0e-6 0.0 None sec Range of times for t2v spline t_max (float) 1.0e-2 0.0 None sec Range of times for t2v spline n_t (int) 250 0 None ‘’ Number of times for t2v spline - Attributes
- Inherited from ::pyclass::pyStruc
Methods
-
__init__(name=u'Gun Toy Computational Experiment', *args, **kwargs)¶ Instantiate the Experiment object
Parameters: None – Keyword Arguments: name (str) – A name. (Default = ‘Gun Toy Computational Experiment’)
-
_fit_t2v(vel, time)¶ Fits a cubic spline to the velocity-time history
This allows simulations and experiments to be compared at the experimental time-stamps
Parameters: - vel (np.ndarray) – Velocity history
- time (np.ndarray) – Time history
Returns: Spline of vel = f(time)
Return type: (Spline)
-
_get_force(eos, posn)¶ Calculates the force on the projectile
The force is the pressure of the HE gas acting on the projectile. The pressure is given by the EOS model
Parameters: Returns: The force in dyes
Return type: (float)
-
_on_call(eos, **kwargs)¶ Performs the simulation / experiment using the internal EOS
Parameters: - eos (Isentrope) – The equation of state model
- **kwargs – Arbitrary keyword arguments.
Returns: Length 3, elements are:
(np.ndarray): Time, the independent variable
(tuple): length 2 for the two dependent variables
- (np.ndarray): Velocity history of the simulation
- (np.ndarray): Position history of the simulation
(Spline): A spline representing the velocity-time history
Return type: (tuple)
-
_on_check_models(models)¶ Checks that the model is valid
Parameters: model (Isentrope) – A new EOS model Returns: A copy of self with the new eos model Return type: (GunModel)
-
_on_str(*args, **kwargs)¶ Print method of the gun model
Parameters: - *args – Variable length argument list.
- **kwargs – Arbitrary keyword arguments.
Returns: A string representing the object
Return type: (str)
-
_shoot(eos)¶ Run a simulation and return the results: t, [x,v]
Solves the ODE
\[F(x,v,t) = \frac{d}{dt} (x, v)\]Parameters: eos (Isentrope) – The equation of state model Returns: Length 2 elements are: - (np.ndarray): time vector
- (list): elements are:
- (np.ndarray): position
- (np.ndarray): velocity
Return type: (tuple)
-
compare(simdata1, simdata2)¶ Compares a set of experimental data to the model
Error is dep less the model_data
-
get_sigma(models)¶ Returns the co-variance matrix
-
plot(axes=None, fig=None, level=0, data=None, linestyles=[u'-k', u'-r'], labels=[u'Model', u'Error'], *args, **kwargs)¶ Plots the gun experiment
Overloads
F_UNCLE.Utils.Struc.Struc.plot()Plot Levels
- The velocity-time history
- The position-time history
- The velocity-position history
- A 4 subplot figure with levels 1-3 as well as the EOS plotted
Parameters: - axes (plt.Axes) – Axes object on which to plot, if None, creates new figure
- fig (str) – A Figure object on which to plot, used for level3 plot
- linestyles (list) – A list of strings for linestyles 0. Data ‘-k’ 1. Error ‘-r’
- labels (list) – A list of strings for labels 0. ‘Model’ 1. ‘Error’
- level (int) – A tag for which kind of plot should be generated
- data (dict) – A list of other data to be plotted for comparison
Returns: A figure
Return type: (plt.figure)
-
shape()¶ Returns the degrees of freedom of the model
Stick
-
class
F_UNCLE.Experiments.Stick.Stick(name=u'Rate Stick Computational Experiment', *args, **kwargs)¶ A toy physics model representing a rate stick TO DO
- Update the __call__ method to not use hardcoded sensor positions
Units
Units are based on CGS system
Diagram
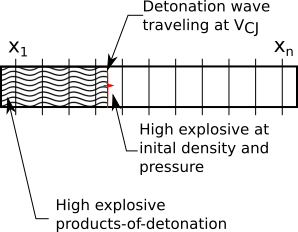
The assumed geometry of the rate stick
Attributes
-
eos¶ Isentrope – The products-of-detonation equation of state
Methods
-
__init__(name=u'Rate Stick Computational Experiment', *args, **kwargs)¶ Instantiate the Experiment object
Keyword Arguments: name (str) – A name. (Default = “Rate Stick Computational Experiment”)
-
_on_call(eos)¶ Performs the rate stick experiment
Parameters: eos (Isentrope) – A valid EOS model Returns: Length 3. Elements are - (np.ndarray): The independent variable, the n sensor positions
- (list): The dependent variables, elements are:
- (np.ndarray): The arrival n times at each sensor
- (list): The lables
- (dict): The other solution data
- ‘mean_fn’(Function): A function returning shock arrivaltime as a function of position
- ‘vel_CJ’(float): The detonation velocity
- ‘vol_CJ’(float): The specific volume at the_CJ point
- ‘pres_CJ’(float): The pressure at the_CJ point
- ‘Rayl_fn’(Function): A Rayleigh line function, see below
Return type: (tuple) Rayleigh Line Function
p = ray(v, vel, vol0, eos)
Args:
- v(np.ndarray): The specific volume
- vel(float): Detonation velocity
- vol_0(float): Specific volume ahead of the shock
- eos(Isentrope): An equation of state model
Return:
- p(float): The pressure along the Rayleigh line at v
-
_on_check_models(models)¶ Checks that the model is valid
Parameters: model (dict) – A dictionary of models Returns: A copy of self with the new eos model Return type: (GunModel)
-
_on_str(*args, **kwargs)¶ Print method of the gun model. Called by Struct.__str__
Parameters: - *args – Variable length argument list.
- **kwargs – Arbitrary keyword arguments.
Returns: A string representing the object
Return type: (str)
-
compare(simdata1, simdata2)¶ Compares the model instance to other data
The error is the difference in arrival times, dep less data.
-
get_sigma(models)¶ Returns the variance matrix
variance is
\[\Sigma_i = \sigma_t^2 + \frac{\sigma_x^2}{V_{CJ}}\]- Where
- \(\sigma_t\) is the error in time measurements
- \(\sigma_x\) is the error in sensor position
- \(V_{CJ}\) is the detonation velocity
-
plot(models, axes=None, fig=None, data=None, level=1, linestyles=[u'-k', u':k', u'ok', u'+k'], labels=[u'Fit EOS', u'Rayleigh Line', u'($v_o$, $p_o$)', u'Inital point'], vrange=None)¶ Plots the EOS and Rayleigh line
Plots the critical Rayleigh line corresponding to the detonation velocity tangent to the EOS.
Parameters: models (dict) – Dict of models
Keyword Arguments: - axes (plt.Axes) – The Axes on which to plot
- fig (plt.Figure) – The figure on which to plot ignored
- data (list) – The output from a call to Stick
- level (int) – Specifies what to plot
- Plots the EOS with the Raylight line intersecting the CJ point
- Plots the output from a simulation
- linestyles(list): Format strings for the trends, entries as follow
- Stlye for the best fit EOS OR The data trend
- Style for the Rayleigh line
- Style for the CJ point
- Style for the initial condiations
labels(list): Strings for the legend
- ‘Fit EOS’ (Change to Data for level 2 plot)
- ‘Rayleigh line’
- ‘v_o, p_o’
- ‘Initial point’
vrange(tuple): Range of volumes to plot
-
shape()¶ Returns the shape of the object
Sphere
-
class
F_UNCLE.Experiments.Sphere.Sphere(name=u'Sphere compuational experiment', *args, **kwargs)¶ A toy physics model representing an expanding plastic sphere driven by HE
-
const¶ dict – A dictionary of conversion factors
-
__init__(name=u'Sphere compuational experiment', *args, **kwargs)¶ Instantiate the Experiment object
Keyword Arguments: name (str) – A name. (Default = ‘Sphere computational experiment’)
-
_on_call(eos, strength)¶ Solves the sphere problem
Parameters: Returns: [0] - times [1](list): Data at each timestep
[0] - velocity of the case [1] - radius of the case [2] - case thickness [3] - specific volume of gasses within case [4] - pressure of gasses within case [5] - stress in the case [6] - strain in the case
Return type: (tuple)
-
_on_check_models(models)¶ Checks that the model is valid
Parameters: model (Isentrope) – A new EOS model Returns: A copy of self with the new eos model Return type: (GunModel)
-
_on_str(*args, **kwargs)¶ Print method of the gun model
Parameters: - *args – Variable length argument list.
- **kwargs – Arbitrary keyword arguments.
Returns: A string representing the object
Return type: (str)
-
compare(data1, data2)¶ Compares a set of experimental data to the model
Error is data2 less the data1
-
plot(data, axes=None, fig=None, linestyles=[u'-k'], labels=[])¶ Plots the object
Parameters: data (tuple) – The output from a call to a Sphere object
Keyword Arguments: - axes (plt.Axes) – The axes on which to plot Ignored
- fig (plt.Figure) – The figure on which to plot
- linestyles (list) – Strings for the linestyles
- labels (list) – Strings for the labels
Returns: A reference to the figure containing the plot
Return type: (plt.Figure)
-
shape(*args, **kwargs)¶ Gives the length of the independent variable vector
-
Cylinder
Note
Cylinder has not been implemented yet